When did you last run a health check on your wallet? 6 ratios to test your financial fitness
In this age of AI disruption
many companies are flattening their org charts
and trimming headcount
At the same time, more and more people are leaning on AI
to run a one-person company
As the line between the individual and the enterprise blurs
many of us are starting to look at our own finances the way a business would
In a capitalist world
learning to use debt and leverage to magnify assets
is, I think, one of the freshest challenges of our time
If you come at it from the angle of an individual or a household
what actually counts as "reasonable and safe" debt?
This article is the reference answer I put together after a bit of digging
so let's run a health check on your finances together
Why bother with a financial check-up?
Prevention beats cure
I think we can all agree on that
so our financial health surely deserves a regular check-up too
to face whatever risks might come our way
Maybe you'll say you've already thought through every possibility
but Morgan Housel, author of The Psychology of Money, puts it like this in Same as Ever:
"Risk is what's left over after you think you've thought of everything."
So this check-up probably can't help you dodge every future financial risk
but it can dramatically raise your odds of surviving once the risk hits
After all, we can never fully prevent every risk
or rather, if we tried to
the cost would likely be even greater
It's like flying: there's risk involved
but if you refuse to take it
there are landscapes you'll never get to see in your life
Six financial metrics: your financial check-up report
I broke the check-up into six metrics
each examining your fitness from a different angle
| Metric | How it's calculated | Healthy range |
|---|---|---|
| Debt ratio | Total liabilities ÷ total assets | 20–50% |
| Current ratio | (Cash + investments) ÷ liabilities due within a year | 1.5–2× |
| Quick ratio | Cash ÷ liabilities due within a year | ≥ 1× |
| Emergency fund | Cash ÷ (monthly expenses + monthly repayments) | ≥ 6 months |
| Runway | (Cash + investments) ÷ total annual outgoings | ≥ 3 years |
| Debt service ratio (DSR) | Monthly repayments ÷ monthly income | < 36% |
That looks like a lot of numbers
but you can really group them into three angles
1. Is your debt structure healthy? (Debt ratio)
Debt ratio = total liabilities ÷ total assets
This looks at how heavy your long-term financial burden is
Conventional wisdom says debt-free is care-free
that lower debt is always better
But from a company's point of view
below 20% can actually mean you're being overly conservative
Moderate, low-interest debt (like a mortgage)
can amplify the growth engine of your assets
Unless you're in a capital-intensive industry up front (airlines, construction)
where the debt ratio might run above 60%
ordinary service and retail businesses
tend to sit around 30%–50%
and I think personal finances lean more toward that kind of company
so for me
20–50% is the range that balances efficiency and safety
2. Can you absorb a shock? (Current ratio / quick ratio / emergency fund / runway)
The debt ratio shows "how much you owe overall, and whether your capital base is big enough"
but what really breaks people
is usually their ability to keep cash flowing and ride out the lean times
- Current ratio: (cash + investments) / liabilities due within a year (≒ 12 × monthly repayment)
- Quick ratio: cash / liabilities due within a year — stricter; cash only, no investments
- Emergency fund: cash / (monthly expenses + monthly repayments)
- Runway: (cash + investments) / total annual outgoings (liabilities due within a year + the rest of your fixed yearly spending)
These metrics look slightly different
but they're really asking the same thing in different ways:
When something goes wrong, how long can you survive? Do you have the cushion to NOT sell at the bottom?
So how should we gauge it?
For one, we can borrow the yardsticks people use for companies as a reference
and I'll add a few views of my own
to test whether you can face whatever risk lies ahead
Here are the bear-market figures for the past ~50 years (1976–2026), measuring how long the S&P 500 took to fall from its peak to the bottom (trough)
(the figures below were provided by AI):
- Mean: 11.3 months
- Median: 9.5 months
- Longest: 31 months (the 2000 dot-com bust)
In other words
even if I were to hit another dot-com-style bust
I'd want to survive it without going bankrupt
and to be able to face a bear market lasting up to 3 years
So for runway I'd aim for 300% or more
meaning I could cover at least 3 years of debt and living costs from my cash and liquid assets
i.e. this little one-person company can survive for at least 3 years
That said, in a bear market your investment assets may shrink too
so do adjust the ratio to your own risk tolerance
For the emergency fund I aim for 6–9 months
plus unemployment benefits, that gets me through roughly a year
so as long as I can get back into the workforce within that year
I won't have to fire-sell any of my investment positions
I can also stretch the fund further by cutting back on spending
or take some short-term work first to ease the cash-flow pressure
I think that's more than enough to ride out the blow of a bear market
As for the last two metrics, current ratio and quick ratio
I do put them in the tool
but I treat them mostly as a reference
The reason is that since I'm treating my personal cash flow like a company's
my debt outgoings should include my living costs
so I prefer to check my cash-flow situation through runway and the emergency fund
3. Can your cash flow take the strain? What is the debt service ratio (DSR)?
To me the most critical metric is the DSR
Debt service ratio (DSR) = monthly repayments ÷ monthly income
The debt ratio above looks at your current asset position
the DSR looks at cash flow
You've surely heard that plenty of companies go under not because they're out of money
but because their cash flow dries up
That's also why so many people advise keeping your mortgage/rent under a third of your salary
Even if your net worth looks beautiful
if four or five tenths of your income goes to servicing debt each month
then the moment a systemic risk hits (a pay cut, job loss, a rate hike)
your cash flow may seize up
The DSR's two lines come from here:
36% comes from the classic US "28/36 rule" for mortgages — all debt repayments should stay under 36% of income
43% was the debt-to-income cap the US CFPB commonly used in the mortgage "ability-to-repay (ATR/QM)" rules (since 2021 the CFPB has shifted to a rate-based test, so 43% is now a historical benchmark)
So this tool uses 36% as the green line, 36–43% as caution, and above 43% as danger
One-click check-up: turn a gut feeling into a signal
Rather than work through each ratio by hand
just drop the numbers straight into the tool
Click 👉 Financial Health Calculator
enter your assets, liabilities, and monthly cash flow
and it instantly computes all six metrics
flagging exactly where you need to pay attention
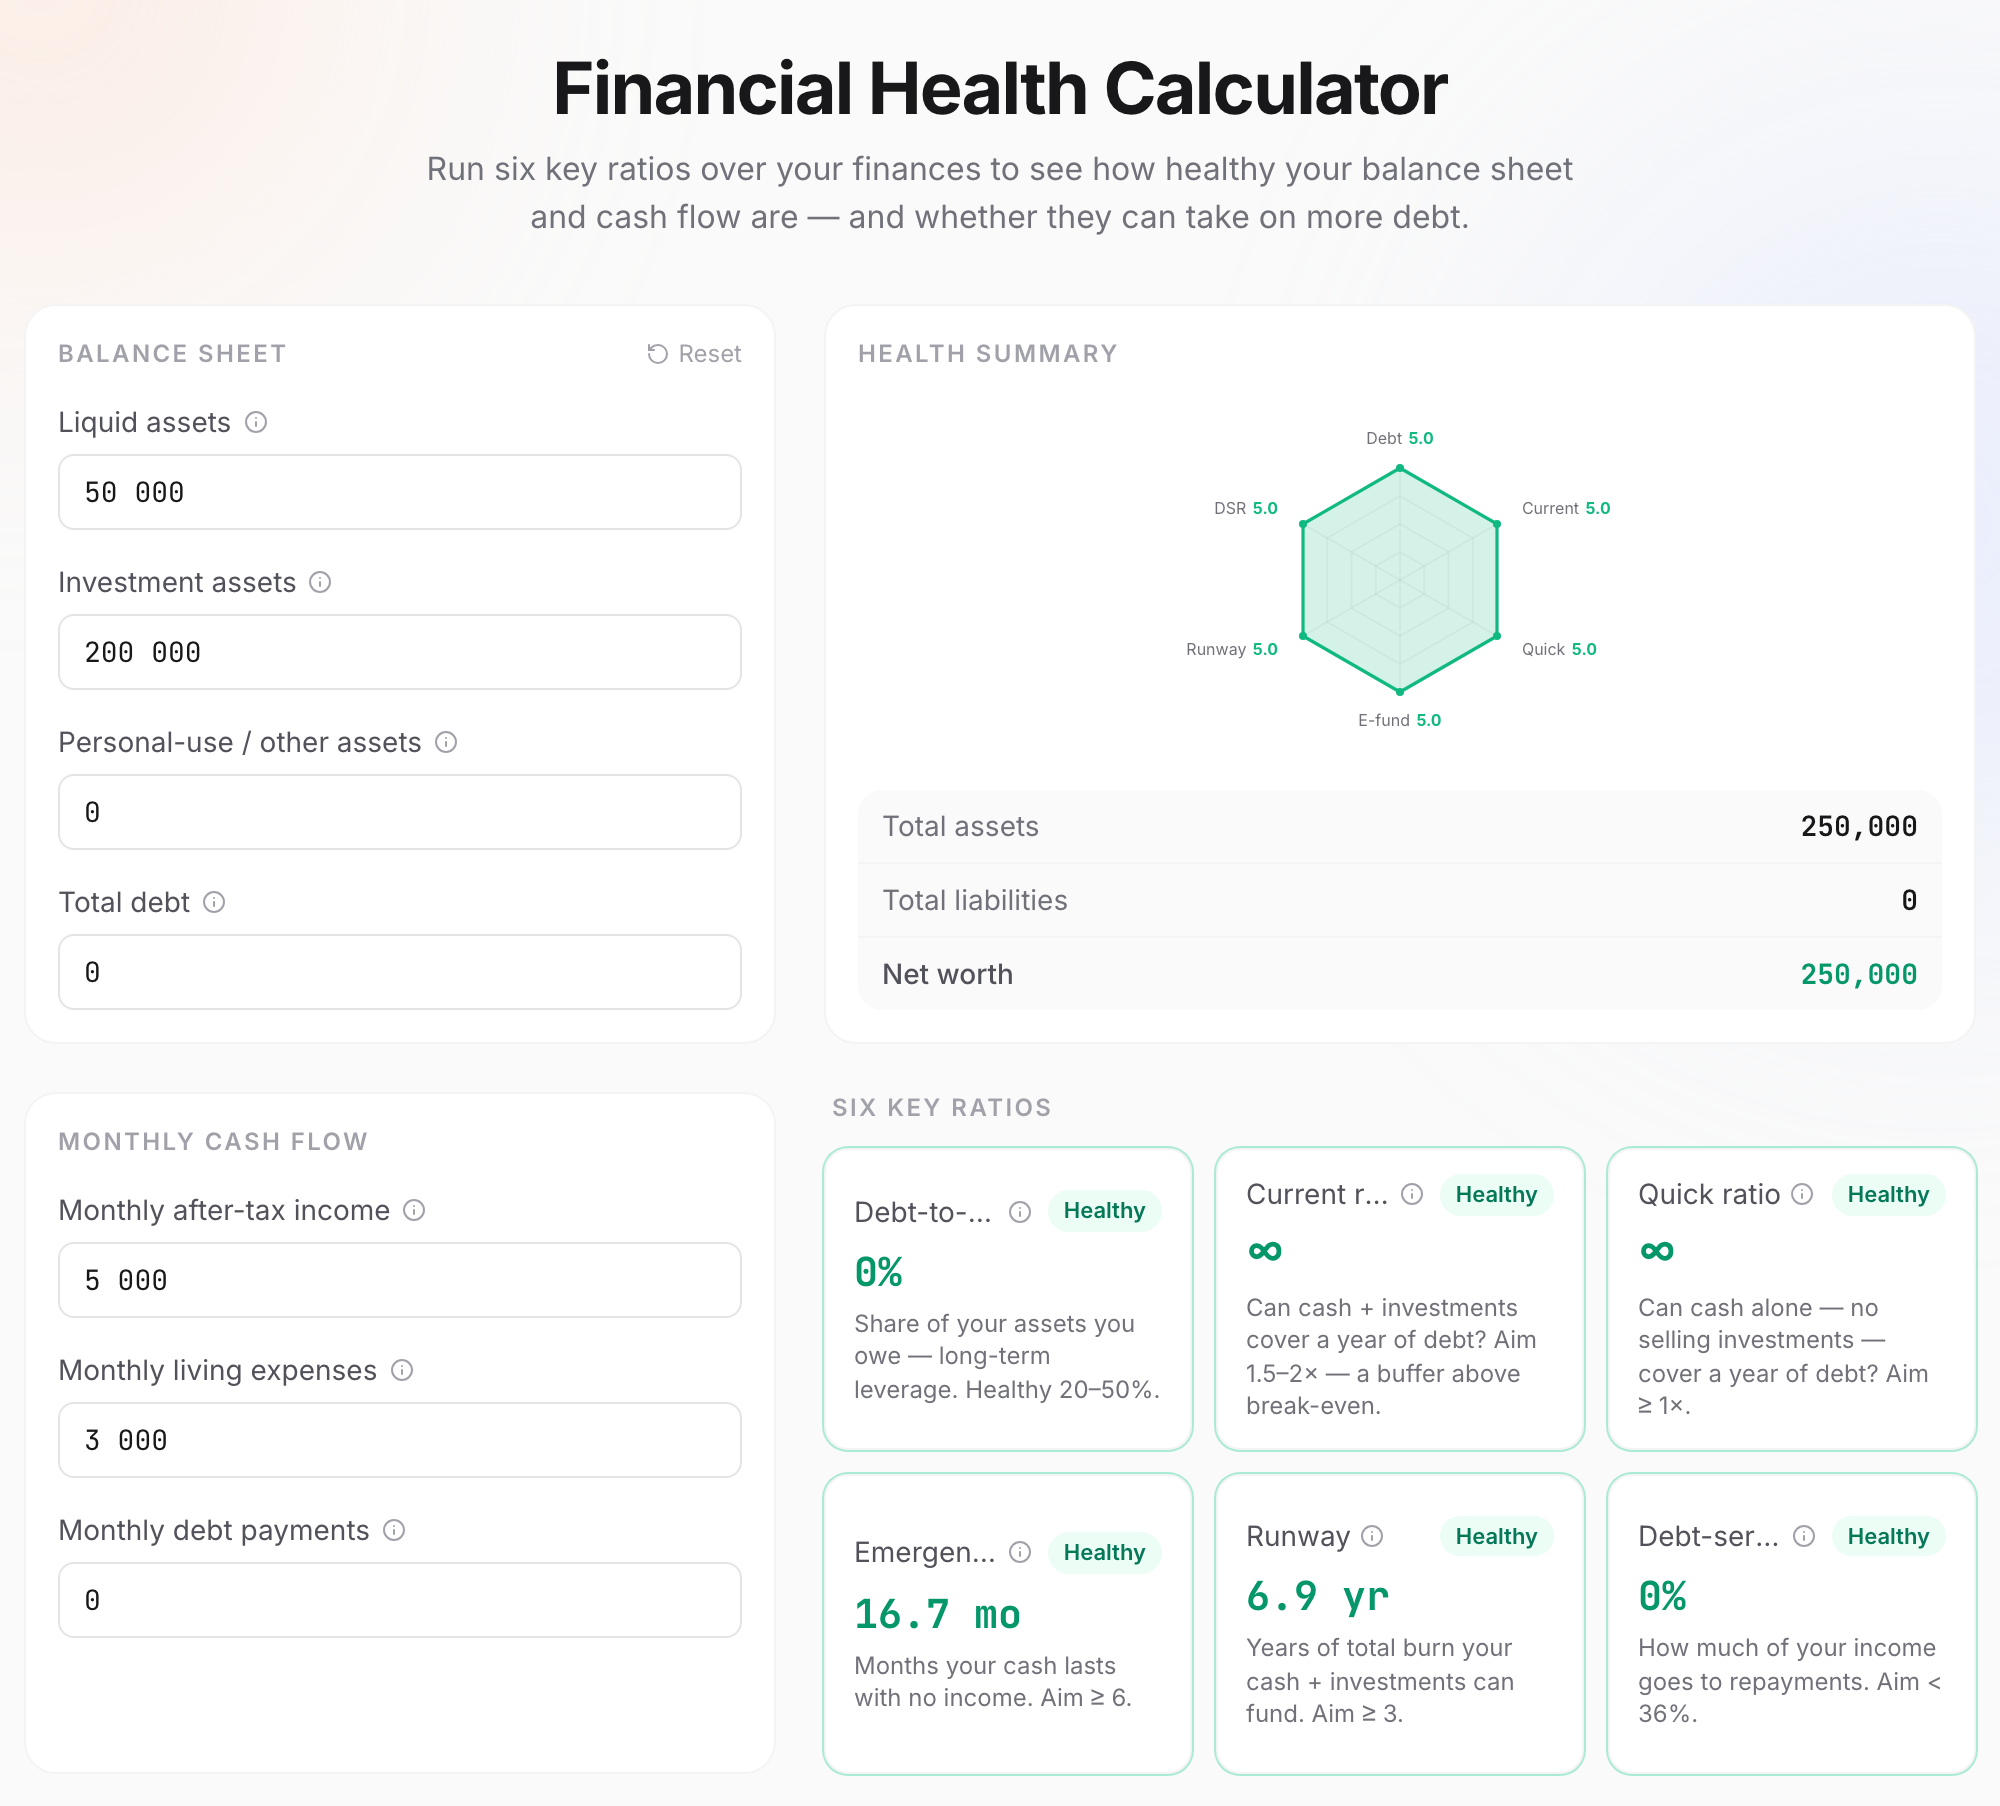
For example
take someone with $50,000 in cash, $200,000 in the stock market
no other assets or liabilities
$5,000 after-tax income a month and $3,000 in living expenses
and you'll see every financial metric land in the healthy range
Every calculation on the page runs locally in your browser
so you can enter your real numbers with peace of mind
(or just knock a zero off them yourself (˘∇˘))
After the check-up: how much more could you borrow?
Echoing the previous post
Borrowing to Invest: Reckless Gamble or Rational Choice?
the same line I ended on there:
What really decides success or failure is rarely how high your return is, but whether you can stay in the market through the worst of it
Whether you can stay put (financially)
comes down to cash flow
which is your DSR
So beyond the check-up, this tool does one more thing:
it works out "how much more you can safely borrow"
mainly by treating the DSR ratio as the primary lever
while also tracking the state of the other metrics
the moment any financial metric comes under pressure
it shows up in a different color and warning
Assuming a 7-year loan at a 4% rate
you can see that even with the DSR pushed to 30%
every financial metric still lands in the healthy range
and if you put that borrowing to good use
it'll certainly help build wealth
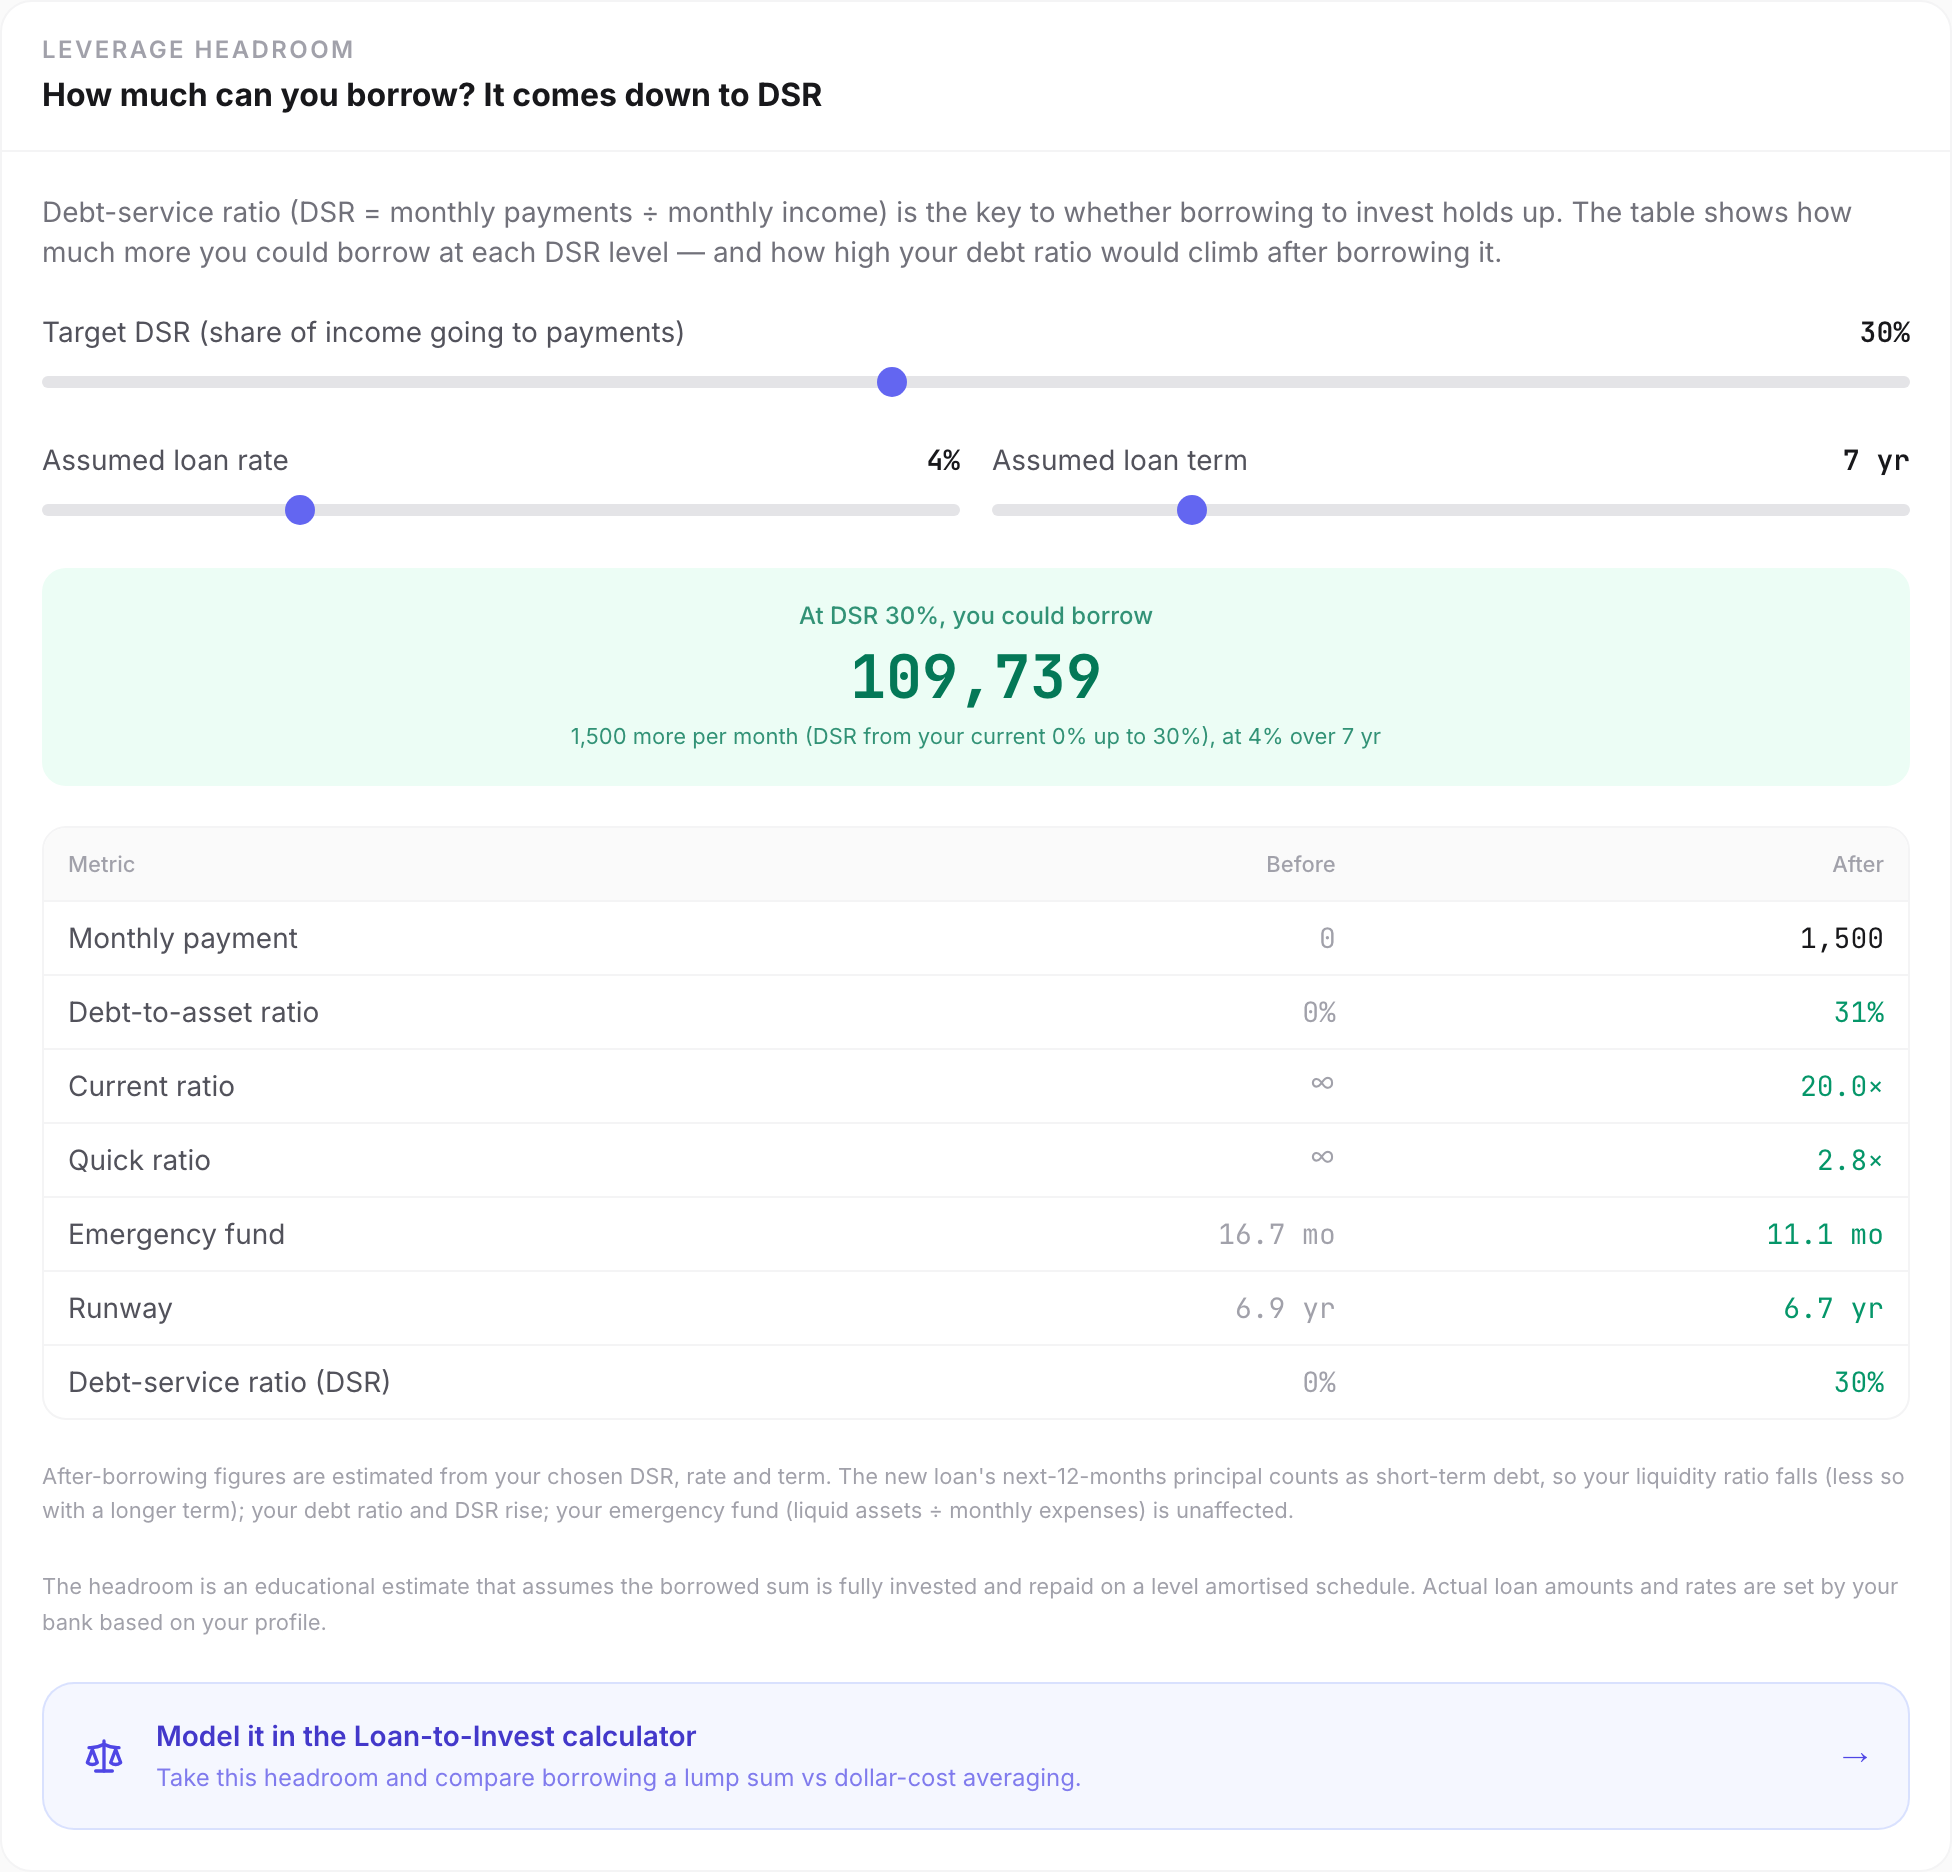
You can drag the DSR slider
to see how tight you're willing to squeeze your cash flow
and how much you can borrow as a result
plus where your debt ratio and current ratio end up after borrowing
Even if you have no need to borrow right now
you'll still get to know whether your finances are healthy as they stand
You can also take this calculated borrowing limit
back to the 👉 Loan-to-Invest Calculator
to compare "a single loan-funded lump sum" vs. "dollar-cost averaging"
and find the way of deploying capital that suits you
Wrapping up
Sometimes I genuinely don't know how much risk I can actually tolerate
so I'm taking this chance to start quantifying my financial situation
- Debt/leverage: check it with the debt ratio
- Cash flow: confirm it with the DSR
- Risk tolerance: runway and the emergency fund
It also forces me to review my financial health every so often
so I can stand on firmer ground knowing that, in this age of surging uncertainty
I'll find out whether I'm swimming naked when the tide goes out (っ◔◡◔)っ ♥
I hope that, in time, I'll find the direction that fits me
and reach my financial goals
I hope this article helped you
The other articles are well worth a read too
and I'd love to hear your thoughts: (♡´◡ 人´◡ ♡)
This calculator and article are for educational reference only. They use generic financial-ratio benchmarks (e.g. debt ratio 20–50%, DSR < 36%, emergency fund of 6 months) and do not account for taxes, rate changes, or your complete personal financial situation. All calculations run locally in your browser and nothing is uploaded. For major financial decisions, please consult a qualified financial advisor.
References and further reading
- Investopedia — Current Ratio
- Investopedia — Debt-to-Income Ratio (DTI / DSR)
- Investopedia — The 28/36 Rule (where the mortgage 36% comes from)
- Investopedia — Qualified Mortgage (where the 43% DTI cap comes from)
- Consumer Financial Protection Bureau — An essential guide to building an emergency fund
- Greninger et al. (1996) — Ratios and benchmarks for measuring the financial well-being of families
- AppicLab — Borrowing to Invest: Reckless Gamble or Rational Choice?
- AppicLab — Complete Guide to the FIRE Retirement Calculator
- AppicLab — The Latte Factor: the compounding power of small money
Frequently asked questions
How is the financial health score calculated?
The tool computes six common personal-finance ratios — debt ratio, current ratio, quick ratio, emergency fund, runway, and debt service ratio (DSR) — and gives each one a healthy / caution / danger signal against its own benchmark. It deliberately does NOT average them into a single score, so you can see exactly which metric is dragging your fitness down instead of having it blurred away by an overall number.
What does "current ratio for the short term, debt ratio for the long term" mean?
They're two time horizons for looking at debt. The current ratio (liquid assets ÷ short-term liabilities) asks whether you'll hit a cash crunch in the SHORT term, borrowing the corporate-accounting standard of roughly 1.5–2×. The debt ratio (total liabilities ÷ total assets) asks how heavy your LONG-term financial burden is, with a healthy band of 20–50%. One short, one long — they cover for each other.
Why isn't a lower debt ratio always better?
A debt ratio that's too high is obviously dangerous, but below 20% can mean you're being overly conservative and using your capital inefficiently — moderate, low-interest debt (like a mortgage) can amplify the growth of your assets. The 20–50% band is generally seen as the sweet spot that balances efficiency and safety; above 75% is where you're genuinely in the danger zone.
Why does the debt service ratio (DSR) matter so much?
The debt ratio looks at the stock on your balance sheet; the DSR looks at the flow of your cash — the share of your income that goes to monthly repayments. Even if your net worth looks great on paper, a DSR that's too high (above 40%) means that the moment income stops or expenses spike, you'll quickly run out of room. Whether borrowing to invest survives a market crash usually comes down to cash flow, not the numbers on paper. Aim to keep DSR under 36%.
Why should the emergency fund sit apart from your investments?
The job of the emergency fund is to let you NOT sell at the bottom when income stops or an unexpected bill lands. If it's mixed in with your investment positions, a market crash may force you to liquidate at exactly the wrong time and lock in the loss. Keep at least 6 months of living costs in liquid assets, and don't count that money as part of the capital you invest with borrowed money.
About the Author
indigo.la.ringo
A software engineer chasing the slash-career dream. Was trying to figure out my relationship with the world — now being forced to figure out my relationship with AI. Lately, obsessed with figuring out the relationship between people and money. Either way, whatever answer I land on, it's fine.
Feedback
Thoughts or suggestions after reading? I'd love to hear them.